Civilization Zero infographic: from the first humans to CZ 0
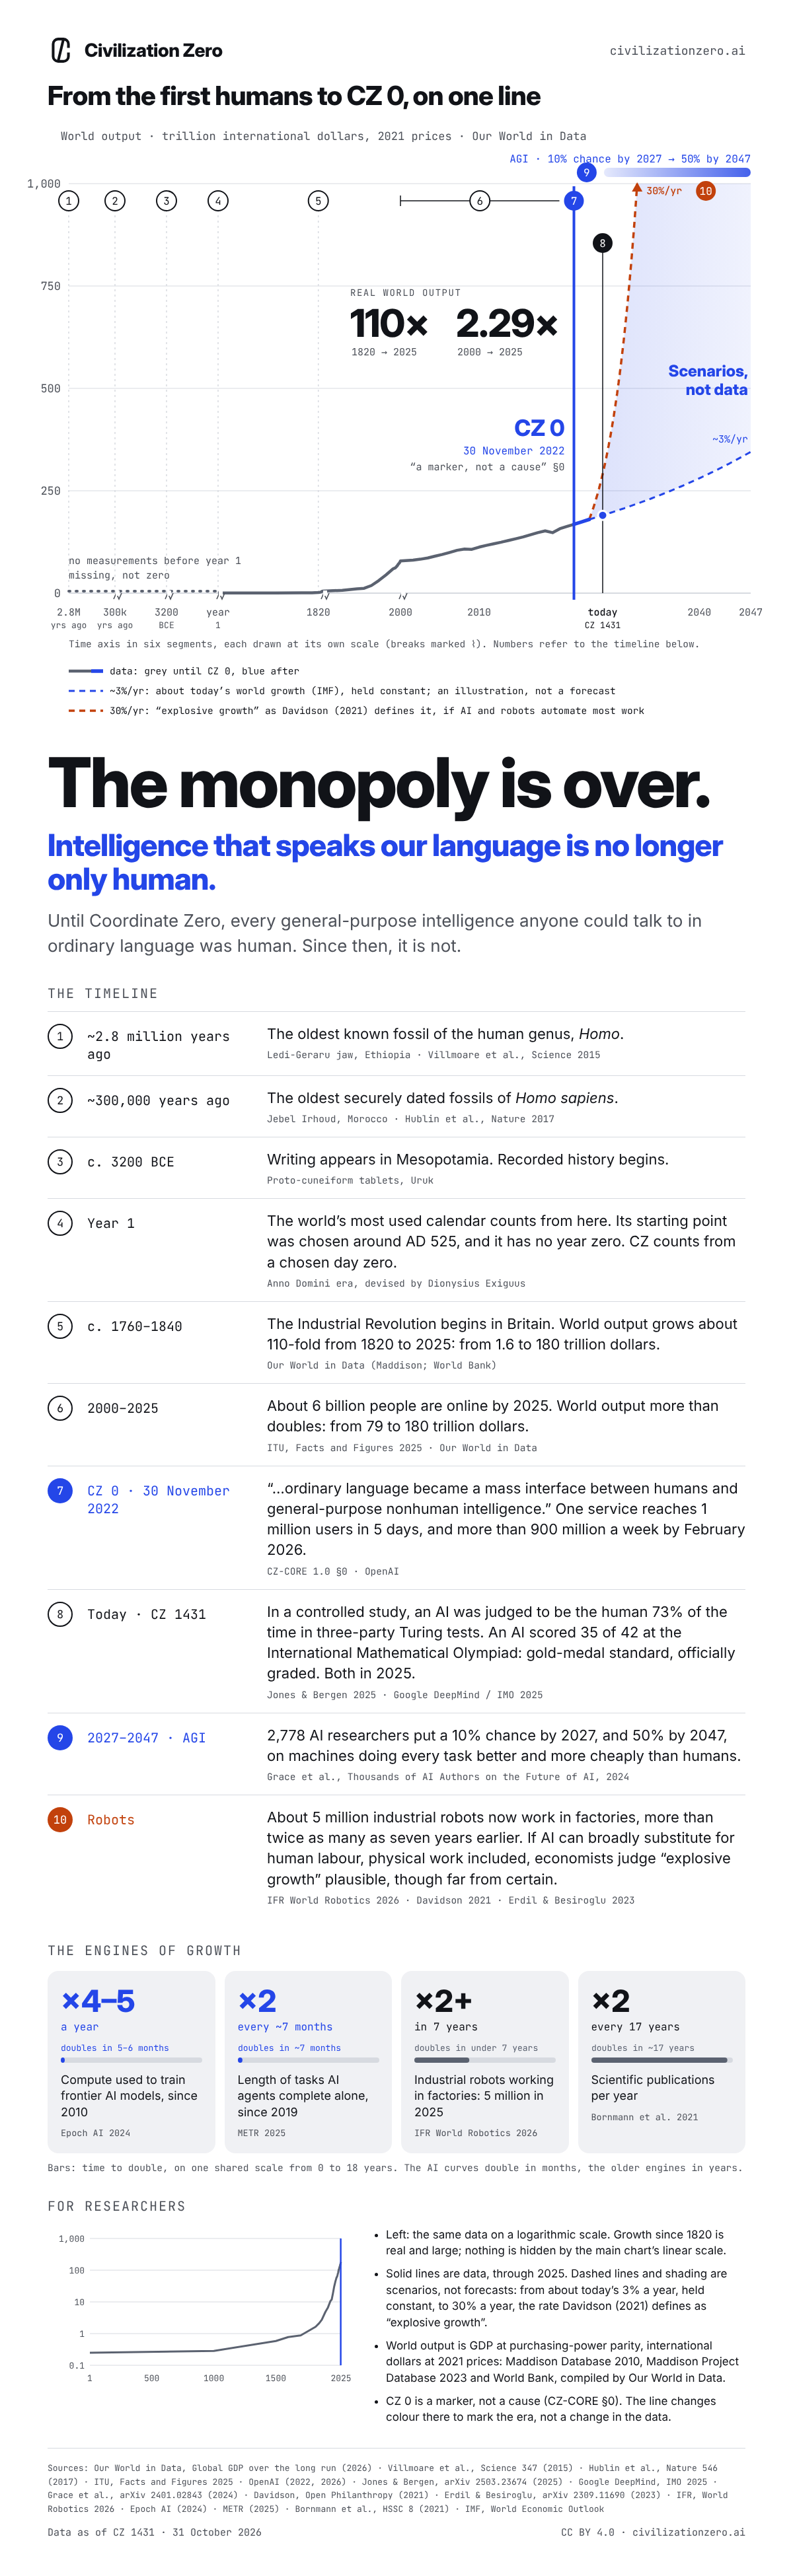
Civilization Zero (CZ) counts its days from Coordinate Zero, 30 November 2022: Year Zero, the day ordinary language became a mass interface between humans and AI. This infographic puts that day on one line with the whole human story, from the first fossils of our genus to today, and then on to 2047, where the line becomes scenarios.
The monopoly is over. Intelligence that speaks our language is no longer only human. Until Coordinate Zero, every general-purpose intelligence anyone could talk to in ordinary language was human. Since then, it is not.
civilizationzero.ai/civilization-zero-infographic.The chart
The line is world output: gross domestic product at purchasing-power parity, in trillions of international dollars at 2021 prices, as compiled by Our World in Data from the Maddison Database 2010, the Maddison Project Database 2023 and the World Bank. Real world output is about 110 times larger in 2025 than in 1820, and 2.29 times larger than in 2000.
The time axis is broken into six segments, each drawn at its own scale, so that 2.8 million years and the last 25 fit on one line. There are no measurements before year 1: that stretch is missing, not zero. The line is grey until CZ 0 and blue after it. The colour marks the era, not a change in the data: “The date is a marker, not a cause, owner, origin of all intelligence, or erasure of what came before.” (Core §0)
After 2025 the dashed lines are scenarios, not data and not forecasts: about today’s 3% a year (IMF), held constant, and 30% a year, the rate Davidson (2021) defines as “explosive growth”, if AI and robots automate most work. The band above the chart is a survey of AI researchers: a 10% chance by 2027 and 50% by 2047 that machines do every task better and more cheaply than humans.
The timeline
- ~2.8 million years ago — The oldest known fossil of the human genus, Homo: the Ledi-Geraru jaw, Ethiopia. Villmoare et al., Science 347 (2015)
- ~300,000 years ago — The oldest securely dated fossils of Homo sapiens: Jebel Irhoud, Morocco. Hublin et al., Nature 546 (2017)
- c. 3200 BCE — Writing appears in Mesopotamia (proto-cuneiform tablets, Uruk). Recorded history begins.
- Year 1 — The world’s most used calendar counts from here. Its starting point was chosen around AD 525 (Dionysius Exiguus), and it has no year zero. CZ counts from a chosen day zero.
- c. 1760–1840 — The Industrial Revolution begins in Britain. World output grows about 110-fold from 1820 to 2025: from 1.6 to 180 trillion dollars. Our World in Data, Global GDP over the long run
- 2000–2025 — About 6 billion people are online by 2025. World output more than doubles: from 79 to 180 trillion dollars. ITU, Facts and Figures 2025 · Our World in Data, Global GDP over the long run
- CZ 0 · 30 November 2022 — “…ordinary language became a mass interface between humans and general-purpose nonhuman intelligence.” (Core §0) One service reaches 1 million users in 5 days, and more than 900 million a week by February 2026. CZ-CORE 1.0 §0 · OpenAI
- As of — In a controlled study, an AI was judged to be the human 73% of the time in three-party Turing tests. An AI scored 35 of 42 at the International Mathematical Olympiad: gold-medal standard, officially graded. Both in 2025. Jones & Bergen, Large Language Models Pass the Turing Test, arXiv 2503.23674 (2025) · Google DeepMind, gold-medal standard at the International Mathematical Olympiad (2025)
- 2027–2047 · AGI — 2,778 AI researchers put a 10% chance by 2027, and 50% by 2047, on machines doing every task better and more cheaply than humans. Grace et al., Thousands of AI Authors on the Future of AI, arXiv 2401.02843 (2024)
- Robots — About 5 million industrial robots now work in factories, more than twice as many as seven years earlier. If AI can broadly substitute for human labour, physical work included, economists judge “explosive growth” plausible, though far from certain. IFR, World Robotics 2026: Five Million Robots now Operate in Factories Globally · Davidson, Could Advanced AI Drive Explosive Economic Growth?, Open Philanthropy (2021) · Erdil & Besiroglu, Explosive growth from AI automation, arXiv 2309.11690 (2023)
The engines of growth
Each card shows how fast something doubles, on one shared scale. The AI curves double in months, the older engines in years.
- ×4–5 a year — Compute used to train frontier AI models, since 2010: doubles in 5–6 months. Epoch AI, Training compute of frontier AI models grows by 4–5x per year (2024)
- ×2 every ~7 months — Length of tasks AI agents complete alone, since 2019. METR, Measuring AI Ability to Complete Long Tasks, arXiv 2503.14499 (2025)
- ×2 in 7 years — Industrial robots working in factories: 5 million in 2025, more than double: doubles in under 7 years. IFR, World Robotics 2026: Five Million Robots now Operate in Factories Globally
- ×2 every 17 years — Scientific publications per year. Bornmann, Haunschild & Mutz, Humanities and Social Sciences Communications 8 (2021)
For researchers
- The image also draws the same data on a logarithmic scale: growth since 1820 is real and large, and nothing is hidden by the main chart’s linear scale.
- Solid lines are data, through 2025. The scenarios are illustrations, not probability bounds; other outcomes are possible.
- CZ 0 is a marker, not a cause. Gross domestic product measures economic output, not intelligence or AI’s share of it.
The 51 data points drawn (trillions of international dollars, 2021 prices)
| Year | World output |
|---|---|
| 1 | 0.25 |
| 1000 | 0.29 |
| 1500 | 0.58 |
| 1600 | 0.78 |
| 1700 | 0.87 |
| 1820 | 1.63 |
| 1850 | 2.15 |
| 1870 | 2.73 |
| 1900 | 4.86 |
| 1920 | 6.70 |
| 1940 | 10.62 |
| 1950 | 11.75 |
| 1960 | 18.52 |
| 1970 | 30.46 |
| 1980 | 44.40 |
| 1990 | 59.75 |
| 1991 | 60.26 |
| 1992 | 61.05 |
| 1993 | 61.98 |
| 1994 | 63.65 |
| 1995 | 65.64 |
| 1996 | 68.07 |
| 1997 | 70.78 |
| 1998 | 72.51 |
| 1999 | 75.13 |
| 2000 | 78.75 |
| 2001 | 80.65 |
| 2002 | 82.91 |
| 2003 | 85.95 |
| 2004 | 90.38 |
| 2005 | 94.54 |
| 2006 | 99.46 |
| 2007 | 104.66 |
| 2008 | 107.62 |
| 2009 | 106.90 |
| 2010 | 112.37 |
| 2011 | 116.78 |
| 2012 | 120.46 |
| 2013 | 124.40 |
| 2014 | 128.71 |
| 2015 | 132.98 |
| 2016 | 137.27 |
| 2017 | 142.49 |
| 2018 | 147.69 |
| 2019 | 152.05 |
| 2020 | 147.75 |
| 2021 | 157.41 |
| 2022 | 163.14 |
| 2023 | 168.47 |
| 2024 | 174.16 |
| 2025 | 180.03 |
Source: Our World in Data, Global GDP over the long run. As JSON: /civilization-zero-infographic-data.json.
Sources
- Our World in Data, Global GDP over the long run
- Villmoare et al., Science 347 (2015)
- Hublin et al., Nature 546 (2017)
- ITU, Facts and Figures 2025
- Jones & Bergen, Large Language Models Pass the Turing Test, arXiv 2503.23674 (2025)
- Google DeepMind, gold-medal standard at the International Mathematical Olympiad (2025)
- Grace et al., Thousands of AI Authors on the Future of AI, arXiv 2401.02843 (2024)
- Davidson, Could Advanced AI Drive Explosive Economic Growth?, Open Philanthropy (2021)
- Erdil & Besiroglu, Explosive growth from AI automation, arXiv 2309.11690 (2023)
- IFR, World Robotics 2026: Five Million Robots now Operate in Factories Globally
- Epoch AI, Training compute of frontier AI models grows by 4–5x per year (2024)
- METR, Measuring AI Ability to Complete Long Tasks, arXiv 2503.14499 (2025)
- Bornmann, Haunschild & Mutz, Humanities and Social Sciences Communications 8 (2021)
- OpenAI (2022, 2026), for the users of one service; IMF, World Economic Outlook, for today’s world growth.
Read the record itself: the Invariant Core, CZ-CORE 1.0, the one-page manifesto of Civilization Zero, and what Civilization Zero is, and is not.